PinnedAhsan Amri RohmaninThe StartupPUBG Mobile Global Championship Season Zero Finals Analysis Using R.Hello, everybody. In this post, I will show you about PUBG Mobile Global Championship Season Zero Finals analysis using R. This post is a…4 min read·Jan 30, 2021----
PinnedAhsan Amri RohmaninThe StartupPUBG Mobile Global Championship Season Zero League Stage Analysis Using R.Hello, everybody. In this post, I will show you about PUBG Mobile Global Championship Season Zero League Stage analysis using R. This…4 min read·Dec 23, 2020----
Ahsan Amri RohmanPUBG Mobile Pro League SEA Season 2 Scrapping and Analysis Using R.Hello, everybody. In this post, I will show you about PUBG Mobile Pro League SEA Season 2 Scrapping and Analysis Using R. This data…3 min read·Nov 11, 2020----
Ahsan Amri RohmanCurrent Weather Dashboard App using R.Hello, everybody. In this post, I created a city-based weather monitoring application. This is a simple application for monitoring the…2 min read·Nov 11, 2020----
Ahsan Amri RohmanMotoGP Season 2014–2019 Scrapping and Analysis Using R.Hello, everybody. In this post, I will show you about MotoGP tournament analysis from any Season 2014–2019. This data collected by…3 min read·Oct 14, 2020--1--1
Ahsan Amri RohmanTop 4 Most Usefull ggplot Extensions.Hello everybody. In this post I will show you top fives most usefull ggplot extensions for data visualization. Data visualization is the…3 min read·Jul 1, 2020----
Ahsan Amri RohmanBoom Esport Grand Final In Every Dota 2 Tournaments.Hello, Everybody. In the previous post, I show you about dota 2 tournament (Grand Final Round) in general. In this post, I will show you…2 min read·Jun 26, 2020----
Ahsan Amri RohmaninAnalytics VidhyaDota 2 Tournament Scrapping Analysis Using R.Hello, everybody. In this post, I will show you about dota 2 tournament analysis from any tier (Liquidpedia Tier) except tier 4. This data…3 min read·Jun 24, 2020----
Ahsan Amri RohmanRe-create Diagram with Katadata.co.id Style using Plotly.Hi everybody. In this post I will show you how to re-create diagram with Katadata.co.id style using Plotly and R programming of course.3 min read·Jun 2, 2020----
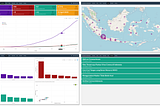
Ahsan Amri RohmaninAnalytics VidhyaCoronavirus Indonesia Dashboard Using R.Hi Everyone. In this post I will show you my project about coronavirus in Indonesia.2 min read·Apr 21, 2020----